Using Google Earth Engine to learn about climate impacts in Peru
Last fall, I travelled to Peru—the country where I was born in—with my husband and some friends. It was truly an adventure-packed trip that left us in awe of the landscapes, culture and history of the Andes.
Rainbow Mountain and the surrounding Red Valley were the most memorable spots we visited during our trip (shockingly Machu Picchu was second on our list!). This place is special for many reasons, including its colourful, striped mineral layers that are etched right on the mountain.
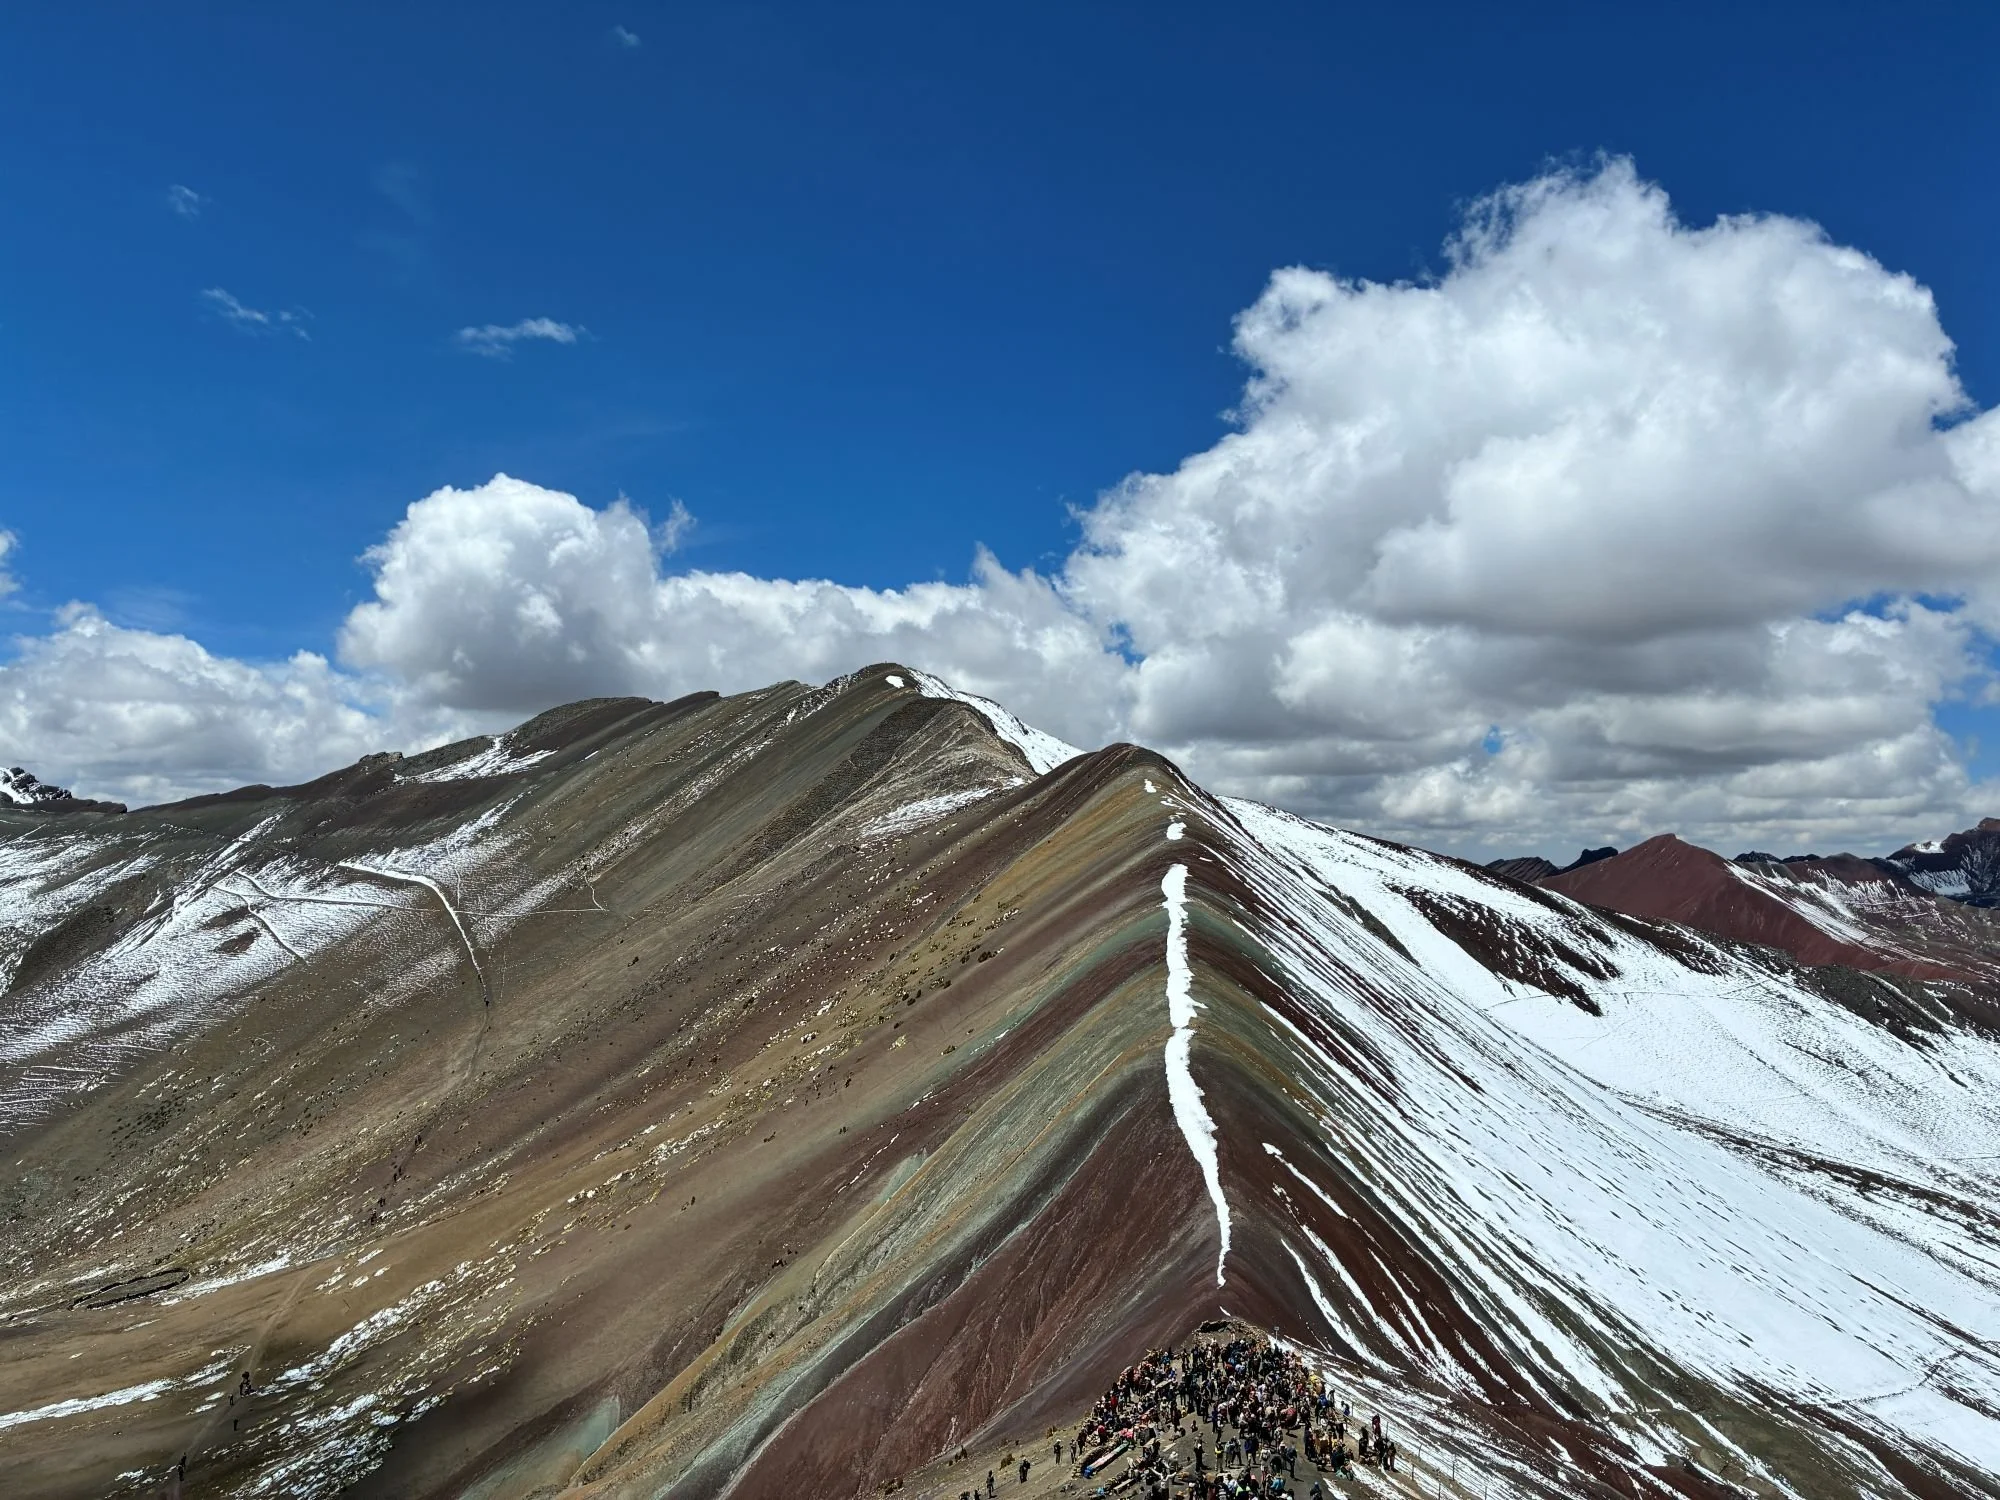
Rainbow Mountain, 2025. © Mike Goldring
One of the things that stayed with me during my trip is learning why I had never heard of Rainbow Mountain as a child growing up in Peru: Rainbow Mountain is only now a tourist attraction because of climate change. Melting snowpacks in recent years have uncovered the mountain making its colours visible. Tourists only started visiting the site in 2016.
What’s happening on Rainbow Mountain made me wonder: can you see these changes in snowpack cover from space?
To dive into that question, I’m using Google Earth Engine—a tool that I’ve only recently started using and I’m fascinated by its many applications.
On my first attempt, sort of
Being a total noob in Google Earth Engine, I followed this tutorial to get me started. I adapted the tutorial to match the WRS ROW/PATH based on my area of interest. This tutorial was useful to create a time series of satellite images of Rainbow Mountain and surroundings.
And though this was a nice time series video, it was hard to appreciate changes in the region without knowing when each satellite image was taken. Was it Peruvian winter (June to September)? Peruvian summer (December to March)?
After spending way too much time figuring out the code for adding a date on each satellite image in the series, I ventured into vibe coding✨.
Using Google’s AI Mode, I wrote this prompt:

Vibe coding prompt
I noticed where the code changed and copied over only those code blocks to my working version. And to my surprise, that worked!
💡Lesson learned: when in doubt, vibe code a little.
And while I will simmered in my success and new life lesson, I was still unsatisfied.
Although the visuals were interesting, was there more I could do with Earth Engine to quantify or measure how the snowpack had changed in the Rainbow Mountain region over the last decade or two?
A satellite image collection that pre-dated 2013 like the one above would also be nice since my guide said Rainbow Mountain only became a tourist attraction in 2016. A few more years of data of what it looked like before 2016 would be helpful for comparison.
Next attempt!
I found a second tutorial to quantify snow cover area for a specific set of dates. This second tutorial is awesome because it shows you how to export charts using Google Earth Engine from the satellite image analysis.
And so, I adapted the script, and I used it to quantify snow cover area in Rainbow Mountain and surrounding areas for the period between 2000 to 2020. I downloaded the data from Google Earth Engine as CSV and re-plotted it in Excel.
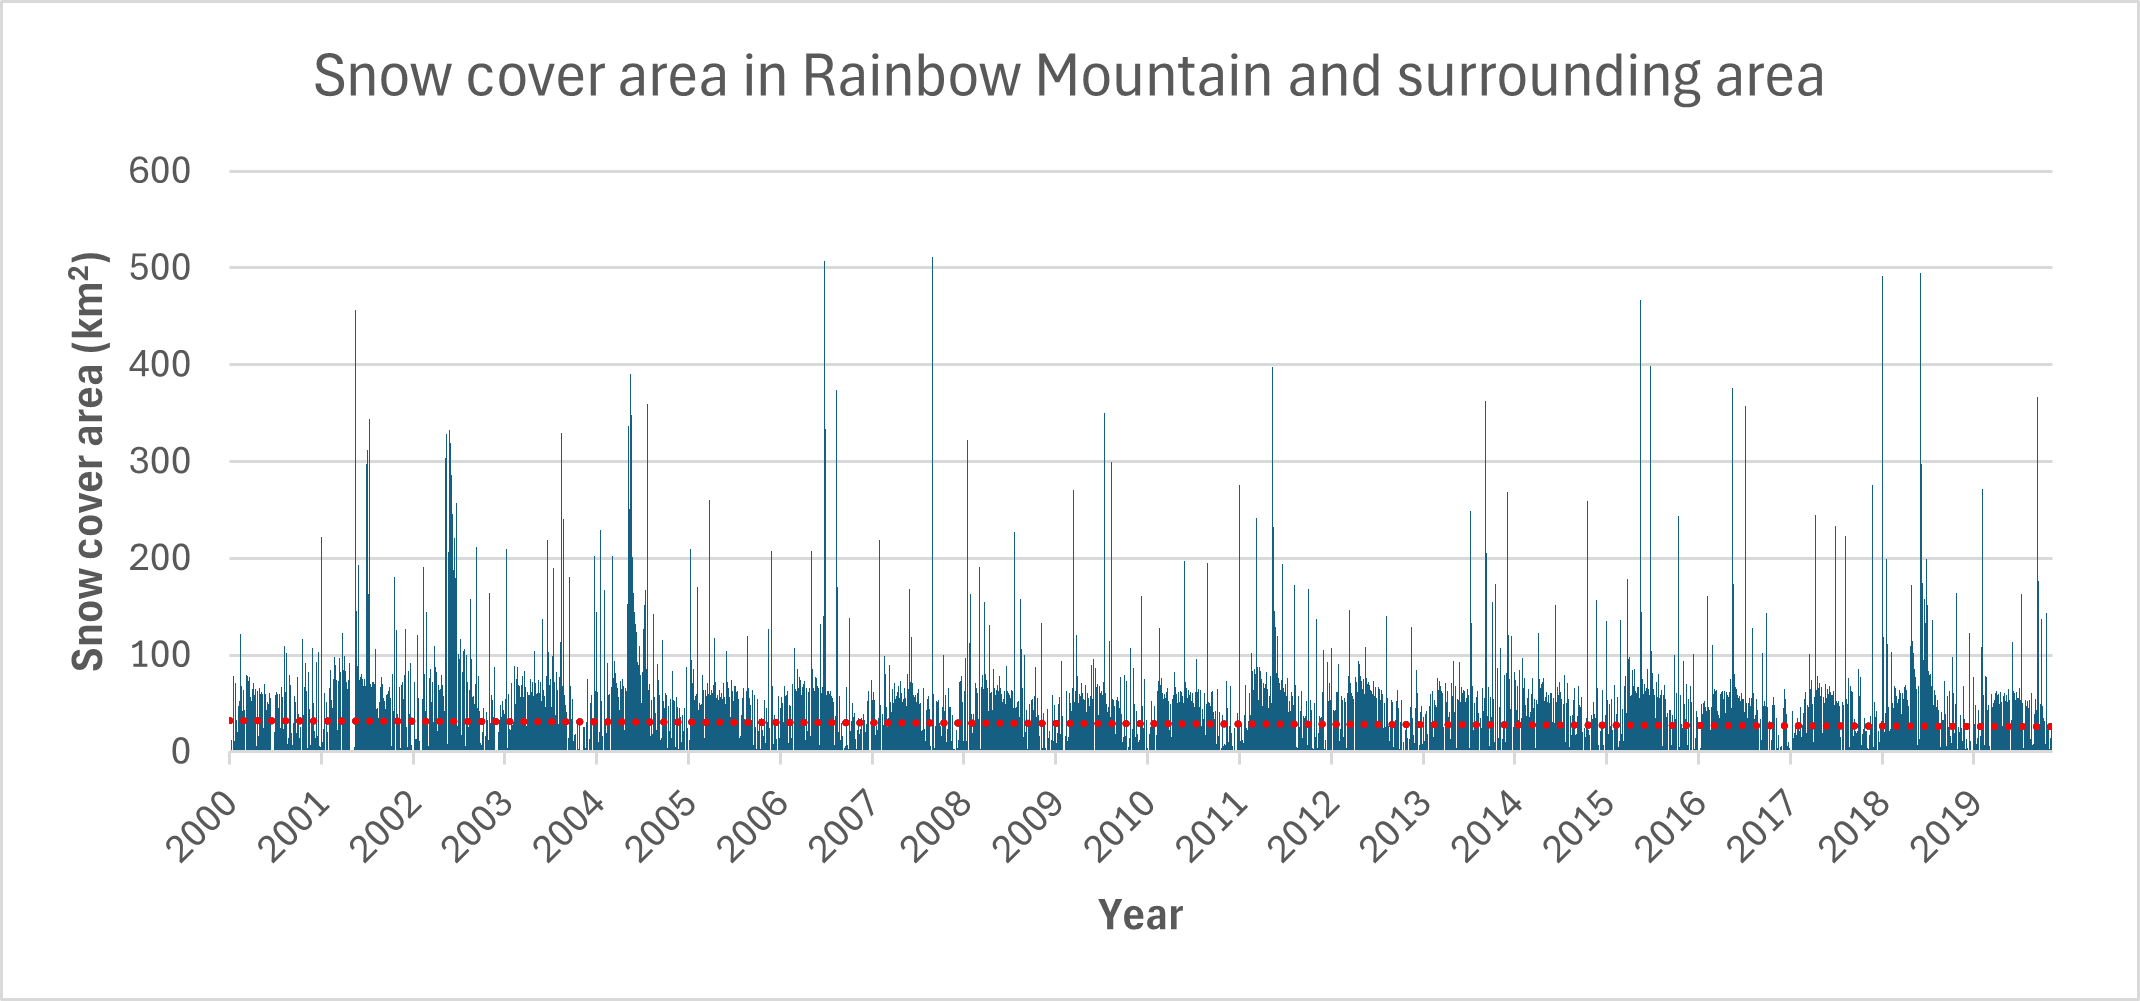
Snow cover area in Rainbow Mountain and surrounding area by year, between 2000 and 2020. Trend line in red.
To me, I see a subtle pattern that there is generally declining snow cover area overtime, but it’s not extremely clear. For example, there seem to be more dates with higher snow cover area between 2000 and 2010 than between 2010 to 2020.
Perhaps if I use a different set of images from a different satellite, there could be more discernible differences. If you have suggestions, make sure you to message me.
For now, I still feel accomplished. I also think that the residents of the Rainbow Mountain region have a much deeper appreciation of local snow cover changes than the satellite imagery set I’m using.
And well with that, I air my noobness of Google Earth Engine to the world. I hope for other noobs like me, you will find this blog post interesting. Perhaps a starting point to your journey with this powerful tool. I certainly have a lot more to learn.
Or at the very least, maybe this blog inspired you to visit Rainbow Mountain and do the trek to 5000 meters above sea level (almost the same as Everest basecamp). It’s hard but not impossible.
And with that, thanks for reading and catch you next time.